
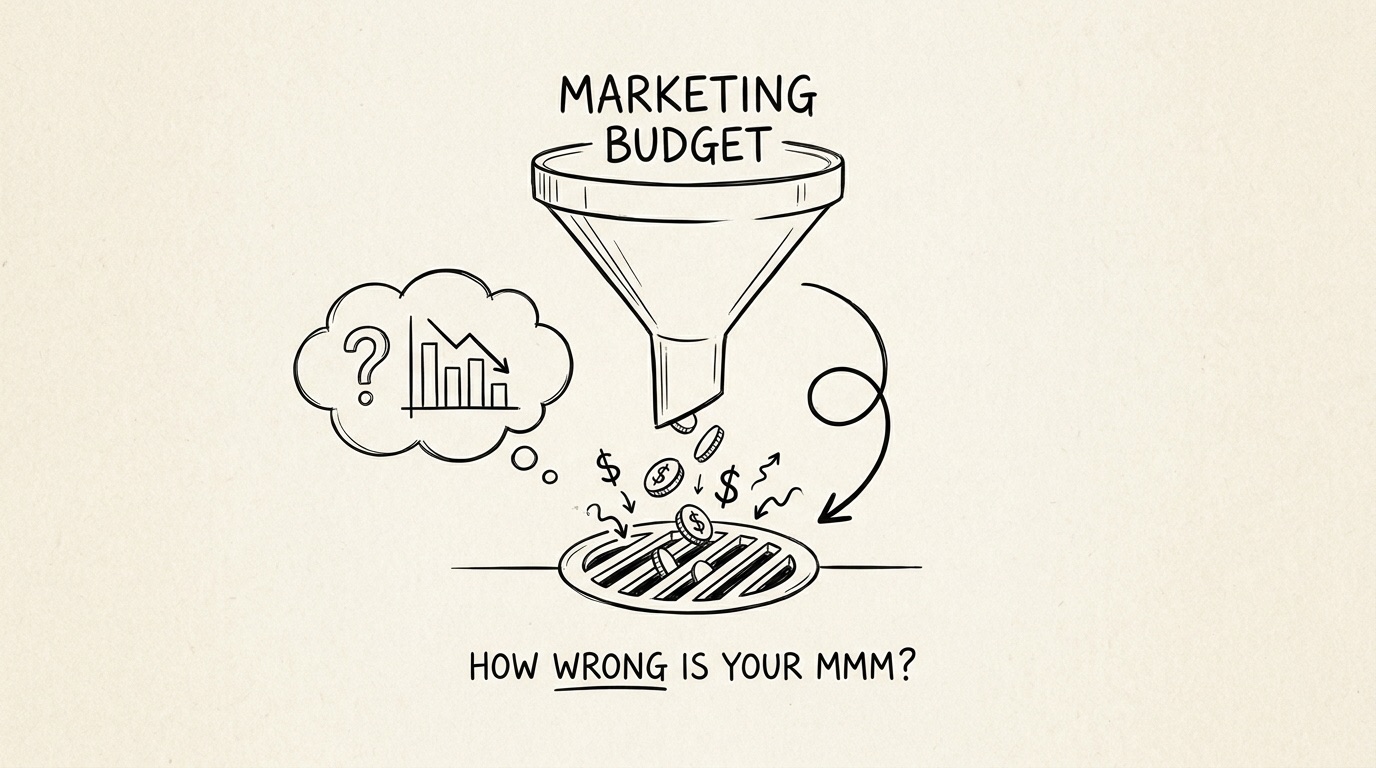
Measuring the return on marketing spend is one of the hardest jobs in growth, but Marketing Mix Modelling has had a resurgence as the answer to it in recent years. Open-source releases have driven most of that: Robyn from Meta, Meridian from Google, Py MC-Marketing from Py MC Labs. Running an MMM has never been easier. Trusting one is a different question. Google set out why back in 2017, in Challenges and Opportunities in Media Mix Modeling, a paper that is still the clearest statement of what goes wrong.
Three of the problems it names do most of the damage. Each one comes from a different kind of variation that is missing from your spend. Multi-collinearity: marketing channels get set in the same planning cycle, so they rise and fall together. No model can separate channels that never moved apart, so the estimates come back with high variance. Selection bias: spend follows demand, with organisations spending more on marketing in peak periods. But as demand itself isn't directly observable, the model has to fall back on proxies for it. Non-identifiable adstock and saturation: a 2024 study titled Your MMM is Broken found these shape parameters are often not separately identifiable from ordinary spend data either.
Google's 2017 paper's own answer was better data. Nearly a decade on, the industry's main response has been incrementality testing, now increasingly used to calibrate MMMs. That is real progress, but it reads one channel at a time and can take months to get a reliable impact. And a 2026 Recast study found most open-source geo-testing tools report a false lift 14-30% of the time.
Step back and all three problems have the same fix: spend that varies in the ways the model needs. This simulation study asks whether a budget phasing algorithm can build all three kinds of variation into a plan. To test this, we need a data generating process where we know the ground truth, achieved by simulating revenue from a known response to marketing. We generate three years of weekly spend for TV, Meta, Search Generic and Tik Tok, with channels following the same underlying signal giving a correlation coefficient of 0.7.
Fonte: Towards Data Science · Resumido por HeadlinesBriefing