
A new model lands at the top of a leaderboard with 71.8%. The runner-up has 70.0%. The table makes that look like a result.
I wanted to know how much of a gap like that belongs to the models, and how much belongs to the particular questions that happened to be in the test. The extreme case is AIME, which has 30 problems. In a single run, one problem is worth 3.3 points, so two models can't differ by 1.8 points.
They differ by zero, or 3.3, or 6.7. Every benchmark has a milder version of the same thing. A score is a count of questions answered correctly, and a count taken from a finite list wobbles.
Evan Miller at Anthropic wrote the standard reference on this in 2024. His advice includes putting error bars on eval scores, comparing two models on the questions they share, and working out how many questions you need before you start. I took that advice and applied it to a leaderboard I built myself, so every number below comes from code you can see.
The setup I scored eight small open models on the same 2,000 questions, drawn at random from MMLU. MMLU is a four-option multiple-choice test across 57 subjects. Each model saw every question with no examples in the prompt, and I read which answer letter (A, B, C or D) it gave the highest probability.
Nothing is generated, which is why the whole thing ran on a Colab T4 GPU. The models were Qwen3-4B-Base, Phi-3.5-mini-instruct, Qwen2.5-3B, Qwen3-1.7B-Base, Qwen2.5-1.5B, Smol LM3-3B-Base, Llama-3.2-3B and Gemma-2-2B. Every model got identical questions, which matters later.
Here is the leaderboard, with 95% intervals around each score. Two things jump out. In the middle, Qwen3-1.7B-Base (60.2%), Qwen2.5-1.5B (59.4%) and Smol LM3-3B-Base (59.1%) sit within 1.1 points of each other.
When I test them against each other on the questions they share, the p-values come out at 0.49, 0.79 and 0.34. There is no evidence of a difference between any two of them. A leaderboard would still print them as #4, #5 and #6.
The other thing is the top. Qwen3-4B-Base scores 71.8% and Phi-3.5-mini-instruct scores 70.0%. I'll come back to that gap after the next experiment.
Re-drawing the benchmark: Treat my 2,000 questions as the whole world. Draw n questions from them with replacement, score all eight models on that draw, and note who finishes first. Do it 2,000 times.
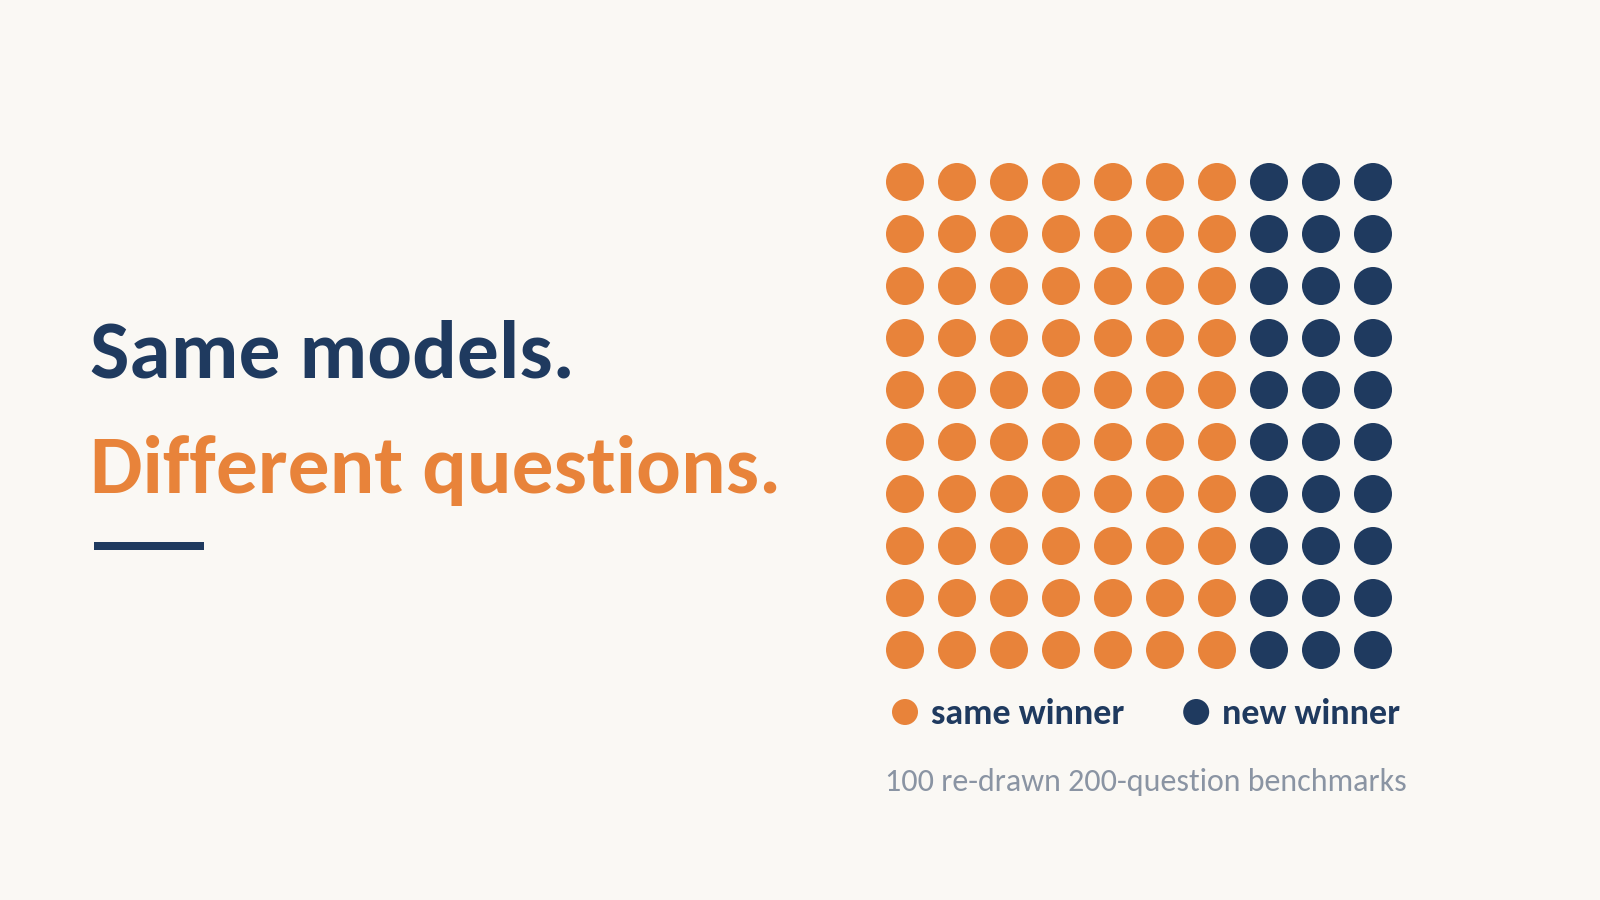
The share of draws where the #1 model is #1 again tells you how much the crown depends on which questions were picked. I ran it at benchmark sizes from 30 questions up to the full 2,000. With 30 questions, the model that is #1 on the full set is #1 again in 45% of draws.
With 100 questions it's 60%, with 200 it's 70%, with 500 it's 82%, and with 1,000 it's 91%. Even using all 2,000 questions it's 96%, not 100%. The top three models keep their exact order in only 12% of draws at 30 questions, 34% at 100, 54% at 200 and 77% at 500.
The dotted lines mark the number of questions in AIME (30), Human Eval (164) and SWE-bench Verified (500). They are there for scale only. These curves belong to my eight models on MMLU.
A benchmark where the top two are further apart would be steadier, and one where they are closer would wobble more. The shape is the useful part. Cut the number of questions and the ranking gets shaky fast.
Same questions, smaller error bars: The error bars on the leaderboard above are 95% binomial intervals, which are the right size for a single model's score but not for comparing two models. When I test them against each other on the questions they share, the p-values come out at 0.49, 0.79 and 0.34. There is no evidence of a difference between any two of them.
A leaderboard would still print them as #4, #5 and #6. The other thing is the top. Qwen3-4B-Base scores 71.8% and Phi-3.5-mini-instruct scores 70.0%.
I'll come back to that gap after the next experiment.
Source: Towards Data Science · Summarized by HeadlinesBriefing