
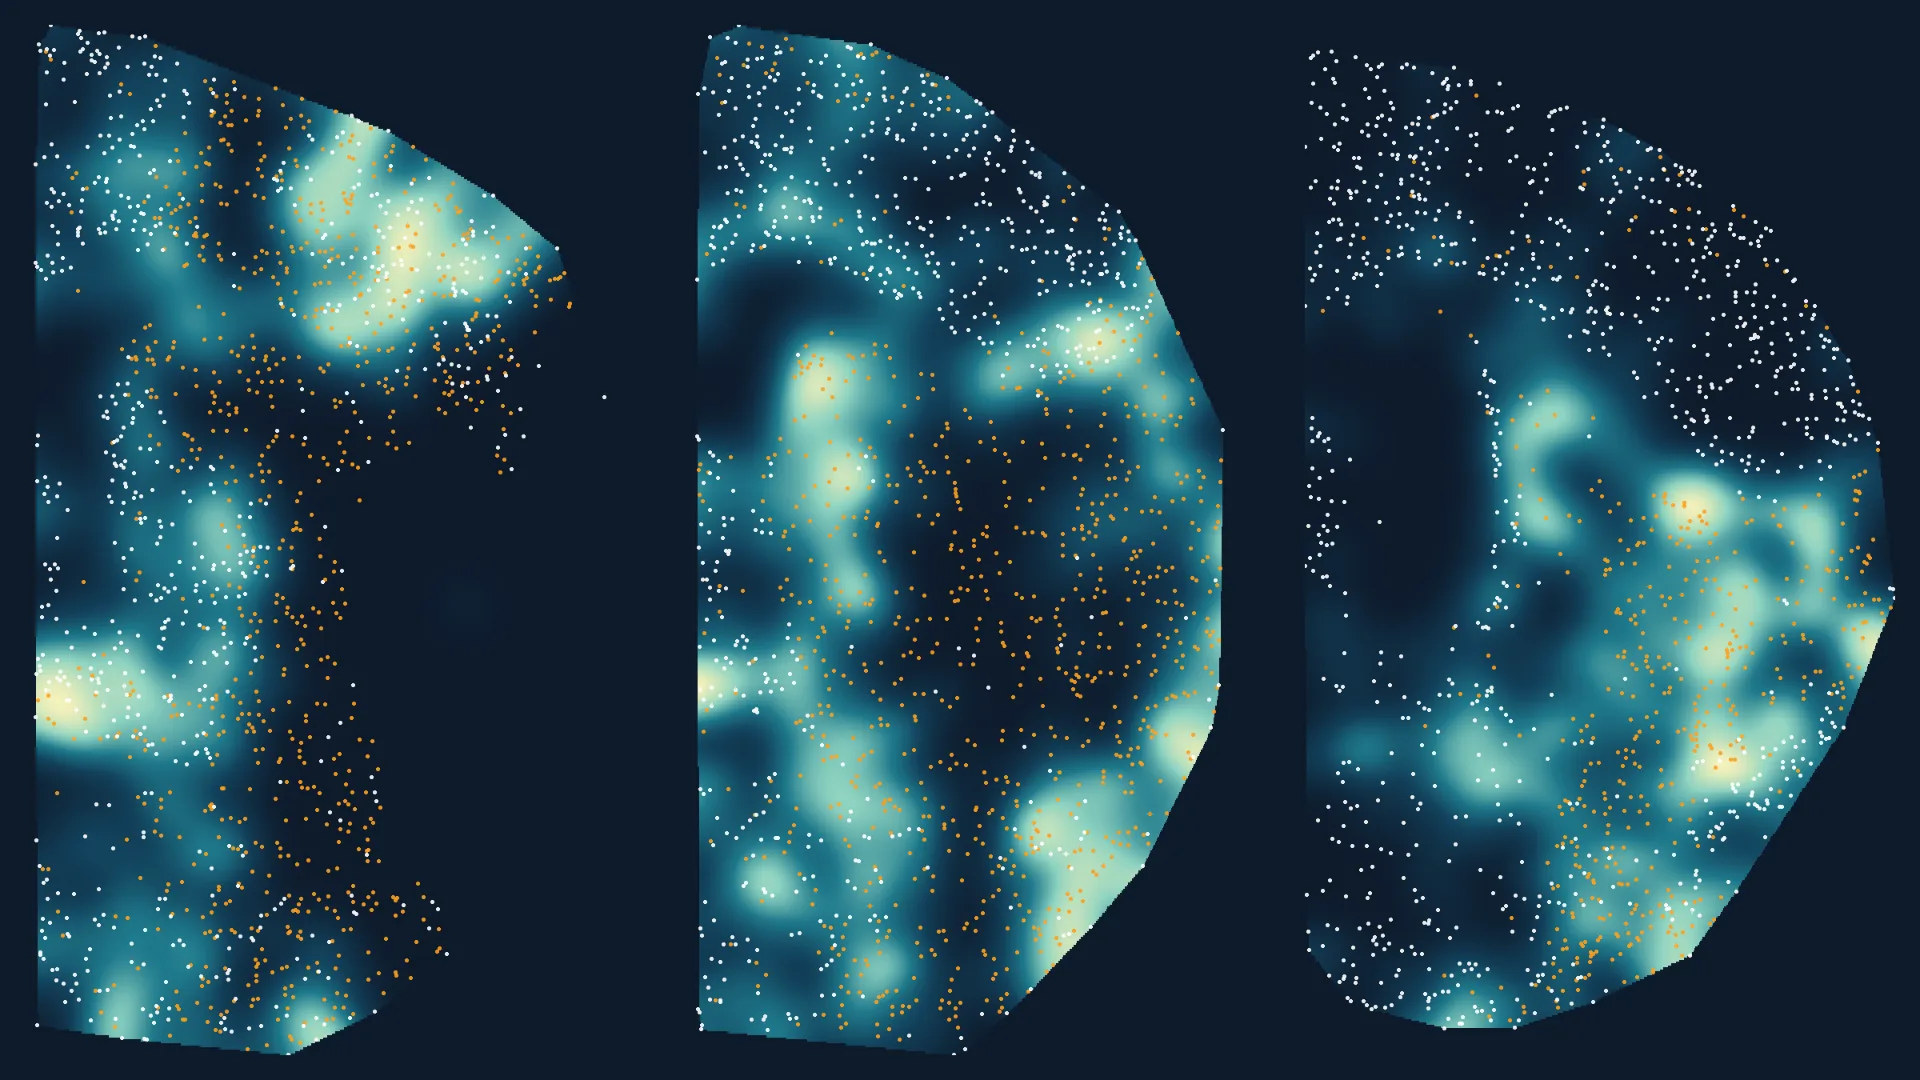
Using spatstat raster layers and point process models, this analysis reveals that the spatial arrangement of neurons, astrocytes, and microglia matters more than their absolute counts. The study shows that a pooled slope across different days post-ischemia (DPI) hides critical changes in cell interactions over time. At 0D, the slope is negative; at 5D and 15D, it becomes positive; and at 30D, it returns to negative. This shift demonstrates that tissue compartmentalization and cell distribution are key determinants of cellular interactions, which raw cell counts cannot capture.
The article teaches readers how to read raster layers as covariates in spatial models, split tissue sections into compartments defined by one cell type, and analyze a second cell type within those compartments. It emphasizes the importance of carrying the animal, not just the pixel, into a Bayesian model to avoid misleading conclusions. The data includes 31 animals across four time points (0D, 5D, 15D, 30D), with astrocyte density increasing from ~156 to over 700 cells per section post-ischemia.
Key tools include the spatstat package for point pattern analysis, brms for Bayesian modeling, and tidybayes for visualization. The study underscores that understanding cell positioning provides deeper insights into tissue dynamics than simple cell counting.
Source: Towards Data Science · Summarized by HeadlinesBriefing