
Statistics often relies on samples rather than entire populations. Measuring the average marks of Class 12 students across India, for example, would be impractical, so analysts draw a sample that is representative of the population and free of systematic bias. Selecting only top scorers, for instance, would inflate the average and misrepresent the true value.
This leads to a common question: why divide the sample variance by (n − 1) rather than n? The answer lies in the fact that the sum of deviations from the sample mean always equals zero. This means only (n − 1) deviations can vary independently, a constraint known as degrees of freedom. Because the sample mean replaces the true population mean, dividing by n would systematically underestimate variance. Dividing by (n − 1) corrects this bias and yields an unbiased estimate of the population variance.
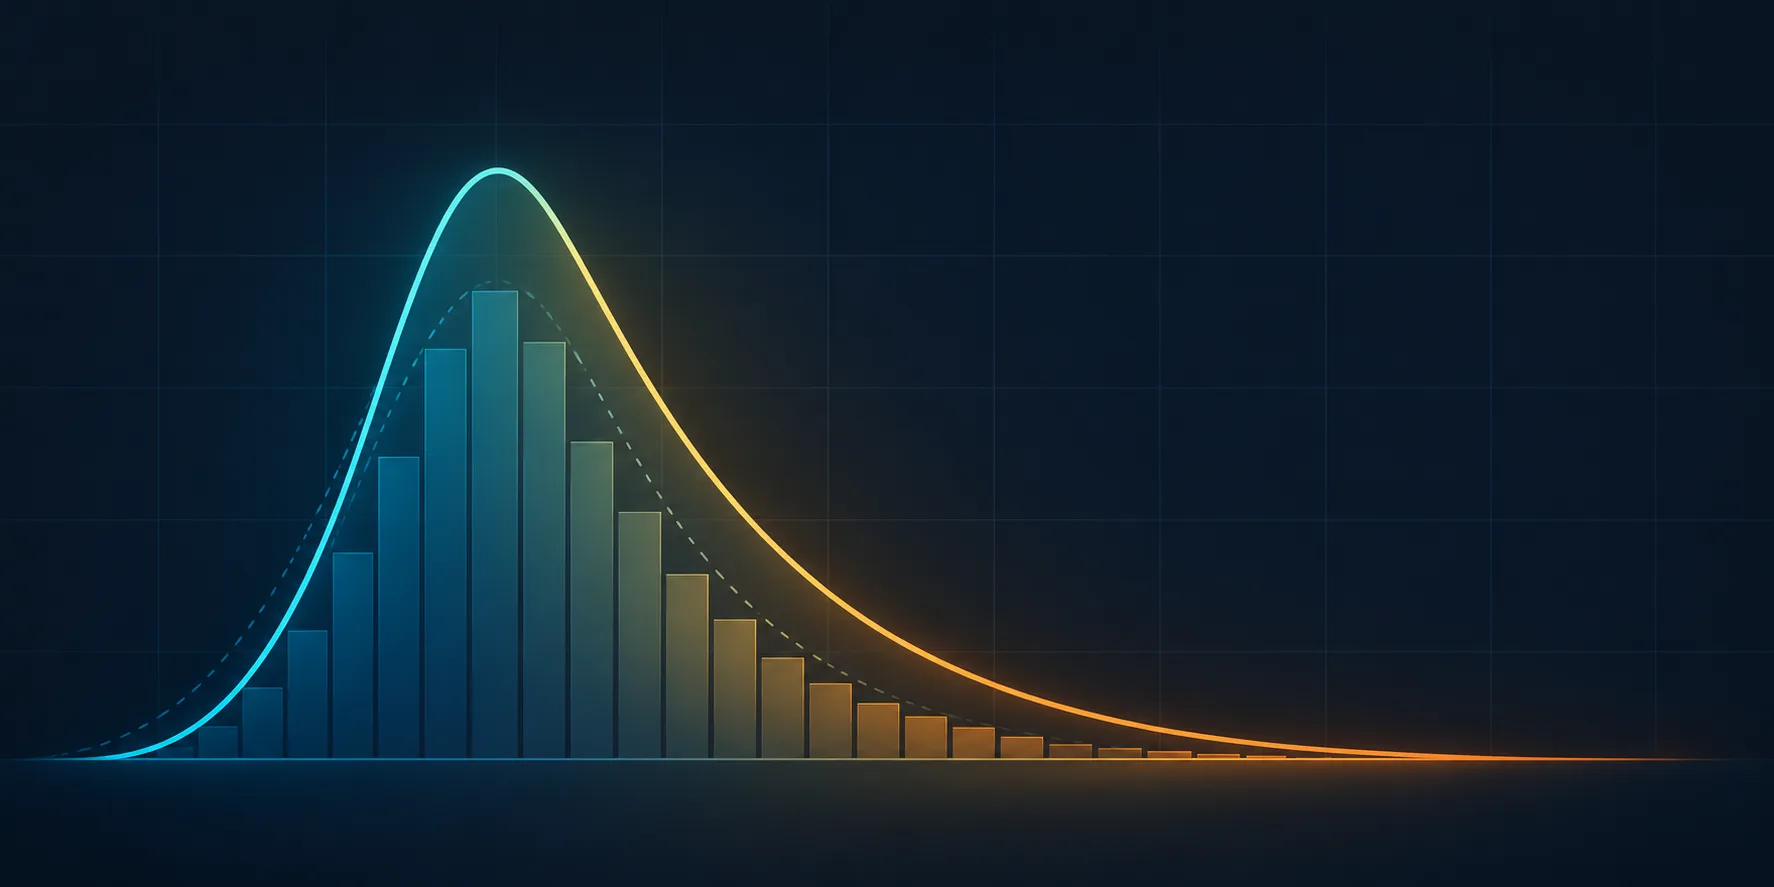
These foundations matter for higher-order statistics. Skewness and kurtosis are measures of distribution shape, and understanding their formulas requires first understanding how population and sample calculations differ. The article builds from these basics toward moments, the building blocks used to describe a distribution's shape.
The discussion then moves into practical use, showing how skewness and kurtosis describe asymmetry and tail heaviness in data. These measures help practitioners check assumptions, detect outliers, and prepare features before applying machine learning models, which is why they are valuable beyond the classroom.
Source: Towards Data Science · Summarized by HeadlinesBriefing