
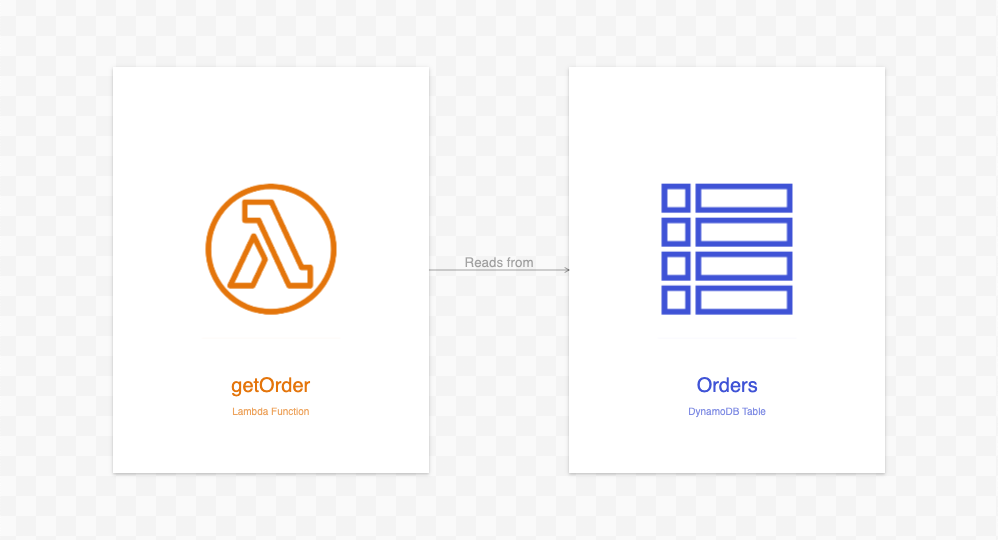
Ilograph launches as an interactive diagramming platform targeting engineering teams who need living architecture documentation. The tool ships with pre-built samples including an AWS Serverless backend reference, a containerized distributed load testing system on AWS, and Stack Overflow's on-premises architecture from 2016-2019 — adapted from Nick Craver's published infrastructure series. Each diagram renders request dependencies, DNS flows, code organization, and authentication paths as explorable perspectives rather than static images.
The platform centers on team workspaces with unlimited diagrams, viewers, custom icons, and full version history. A standout feature exports diagrams to standalone HTML files that run anywhere without Ilograph dependencies — useful for air-gapped environments or client deliverables. Merge conflict resolution handles concurrent edits with automatic and manual modes, while IP-based API access controls suit security-conscious deployments.
Pricing starts at $18/month billed annually for Pro tier, which unlocks custom icons, private sharing links, and unlimited history. The free tier restricts icon libraries and export capabilities. Ilograph's approach treats diagrams as version-controlled artifacts rather than drawings, aligning with how modern teams manage infrastructure-as-code.
For teams drowning in outdated Confluence pages, Ilograph offers a pragmatic path: import existing diagrams, enforce review workflows via merge requests, and publish self-contained HTML that survives tool migrations. The Stack Overflow reference diagram alone demonstrates the depth possible when architecture documentation becomes queryable.
Source: Hacker News · Summarized by HeadlinesBriefing