
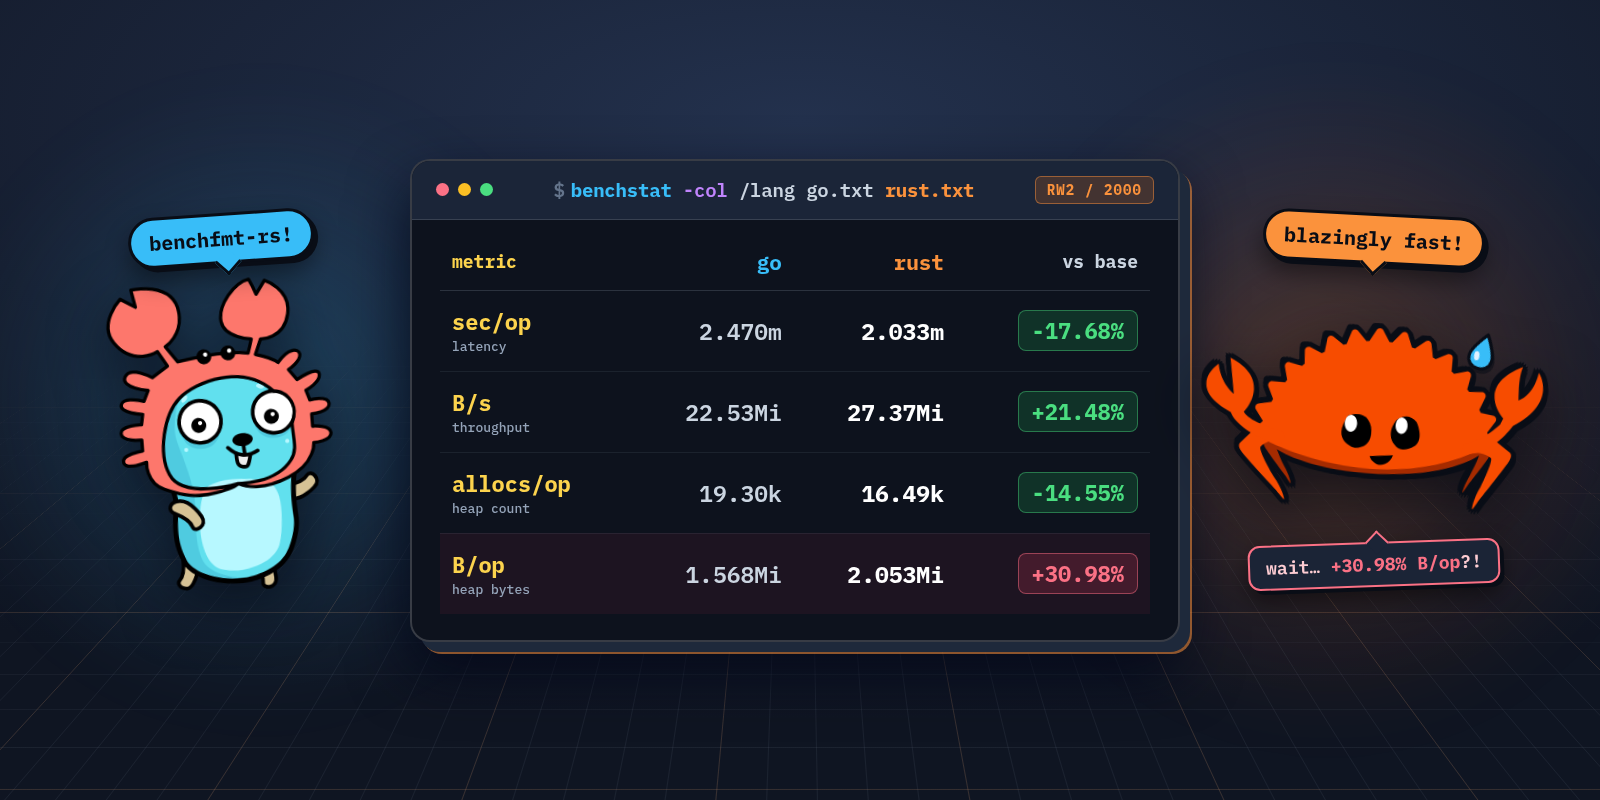
TL; DR: I built benchfmt.rs, a zero-dependency Rust benchmark runner and Criterion converter for Go's benchstat. It adds key-value projections, heap tracking for allocated bytes and objects per operation, and pprof profiling. Recently, I've been working on Rust projects across Google and open source.
I came to Rust after years of writing performance-sensitive Go in Prometheus, Thanos, and teaching Go in the "Efficient Go" book. For me, much of Rust's performance story is really good, until I wanted to run A/B microbenchmarks. Perhaps I was spoiled by the Go benchmarking ecosystem, with the go tool -bench and benchstat in the center.
To me, Rust standard benchmarking tools are lacking: standard format for case comparison projections, standard heap allocation measurements, standard pprof support, and simple to understand reliability scoring. DISCLAIMER: A standard here means something that will be familiar to a large number of developers, and I biased on Go experience for sure! As a result, I asked myself: can we get benchstat-compatible output for Rust microbenchmarks? Wouldn't that make A/B testing easier and unlock fun Go vs Rust comparisons? Here we are! I built benchfmt.rs, a zero-dependency Rust benchmark runner with a thread-local heap allocation counter, pprof profiler integration, and the same CLI flags as go test -bench. For those who don't trust a new benchmarking runtime, it also ships a Criterion and libtest converter that emits Go's benchfmt format directly.
In this blog post, we will implement the same pieces of code in Go and Rust, benchmark them across different Rust frameworks, and compare the results. We might learn something new along the way (I did when building this!). All benchmark code and raw outputs live in bwplotka/benchmarks/benchmarks/rust-go-decode.
We pick two workloads to implement and benchmark in both Go and Rust. I am particularly curious about protobuf decoding performance, which, funny enough, is often one of the main costs of running distributed systems these days. Thus, let's decode our Prometheus Remote Write 2.0 protocol.
Because protobuf code generators have different maturity and trade-offs across languages, let's also measure something simpler alongside it, a standalone varint decoder. Workload details: Decode Varints. A 36-line unsigned LEB128 varint stream decoder.
Varints are the integer encoding underneath Protocol Buffers. Our fixture varints_2000.bin is 4,798 bytes and packs 2,000 uint64 values mixing 1-byte symbol indices, 2-byte bucket offsets, 4-byte deltas, and 6-byte millisecond Unix timestamps. The function writes into a preallocated 2,000-element slice with zero heap allocations.
Decode Remote Write2. A full HTTP request body decoder for Snappy-compressed Remote Write 2.0 (io.prometheus.write.v2. Request) payloads.
We test batches of 200 and 2,000 series, where 2,000 matches Prometheus's default max_samples_per_send. The 2,000-series fixture mixes counters, gauges, classic and native histograms, 1,000 trace exemplars, and metric metadata. Remote Write 2.0 interns all strings into a top-level symbols table and stores packed varint labels_refs per series.
That shrinks the 2,000-series batch to 244.9 KiB uncompressed and 57.0 KiB Snappy-compressed.
Source: Hacker News · Summarized by HeadlinesBriefing